



Key figures
Business Growth and 2026 Forecast
Forecast Turnover
Safe-PCB group for year 202633 500 K€
Yearly growth rate
Safe-PCB organic growth –10 years20%
This chart shows the evolution of orders recorded by Safe-PCB Group over the past 10 years. Without an external acquisition strategy, the group’s activity grows solely through organic growth. For 2026, Safe-PCB Group forecasts a total turnover close to €33,500,000.

Order quantity
Forecast Order qty
Safe-PCB group for year 202650 500 orders
New projects
Safe-PCB group for year 202557%
46,000 orders were registered in 2025. The growth is high and steady, in line with our sales. 57% of orders are new projects (prototypes, pre-series). 43% are reorders (series). For 2026, we expect to deliver 50,500 different orders.
Product segmentation
Safe-PCB masters all the processes of the main families of printed circuit boards. This chart illustrates the repartition of our 2025 revenue across these segments. Safe-PCB has strong expertise in managing complex multi-layer projects. To align with market trends in Europe, our partner Safe-Company Limited in China has invested heavily in advanced equipment, resulting in a significant increase in HDI project production.
Multilayer PCBs – recognized expertise
Layers Years | 4 | 6 | 8 | 10 | 12 | 14 | 16 | 18 | 20 | 22 | Total Qty |
|---|---|---|---|---|---|---|---|---|---|---|---|
| 2012 | 365 | 40 | 4 | - | - | - | - | - | - | - | 409 |
| 2013 | 897 | 109 | 15 | - | - | - | - | - | - | - | 1021 |
| 2014 | 1525 | 214 | 39 | 2 | 4 | - | - | - | - | - | 1784 |
| 2015 | 2738 | 413 | 96 | 19 | 10 | - | - | - | - | - | 3276 |
| 2016 | 3896 | 586 | 176 | 50 | 17 | 1 | - | - | - | - | 4726 |
| 2017 | 5322 | 1010 | 277 | 76 | 32 | 9 | 1 | - | - | - | 6727 |
| 2018 | 6747 | 1340 | 374 | 81 | 49 | 10 | 6 | - | - | - | 8607 |
| 2019 | 9243 | 2105 | 585 | 141 | 68 | 17 | 18 | 3 | - | - | 12180 |
| 2020 | 9055 | 2066 | 548 | 150 | 84 | 14 | 7 | 2 | 2 | - | 11928 |
| 2021 | 11874 | 2989 | 865 | 238 | 92 | 22 | 10 | 2 | - | - | 16092 |
| 2022 | 11368 | 2979 | 1002 | 215 | 120 | 27 | 20 | - | 1 | - | 15732 |
| 2023 | 12268 | 3256 | 1153 | 294 | 125 | 38 | 34 | 2 | - | 1 | 17171 |
| 2024 | 13640 | 3865 | 1389 | 382 | 171 | 50 | 54 | 11 | 1 | 1 | 19564 |
| 2025 | 13812 | 4344 | 1592 | 419 | 209 | 73 | 43 | 17 | 1 | 1 | 20511 |
| 2026 | 12708 | 4108 | 1697 | 475 | 228 | 76 | 40 | 11 | 4 | 5 | 19352 |
| Total Qty | 115 458 | 29 424 | 9 812 | 2 542 | 1 209 | 337 | 233 | 48 | 9 | 8 | 159 080 |
Thanks to the constant increase in the number of projects and the technological diversity they involve, Safe-PCB today stands out as a benchmark expert in the manufacture of high-quality multilayer PCBs. Quantity of different projects processed: 4 layers: 115,500 6 layers: 29,400 8 layers: 9,800 10 layers: 2,500 12 layers: 1,200 14+ layers: 640
FLEX Printed Circuits Boards
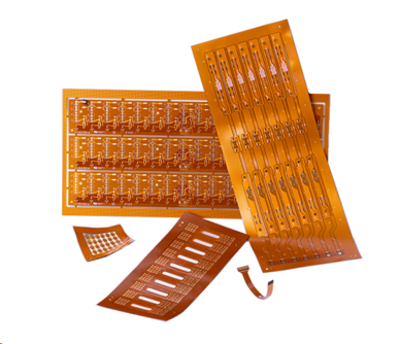
Initiated in 2019 with a few pilot projects, the manufacturing of Flex PCBs is now well established. Number of different projects handled by Safe-PCB by the end of 2025: 2,026 FLEX projects
FLEX orders – consolidated data Safe Group 2019.. 2025, 2026 forecast
RIGID-FLEX Printed Circuits
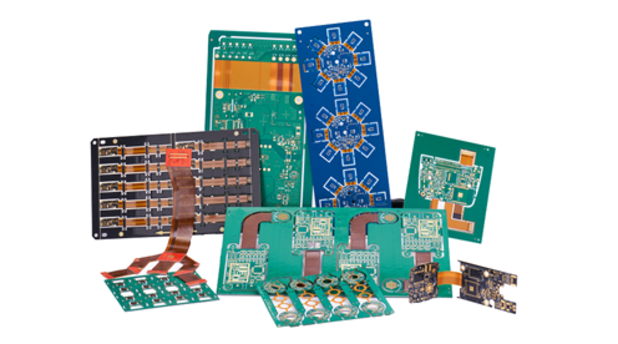
Assembly of FR4 and FLEX circuits (polyimide ). The first projects were launched in production in 2019 alongside FLEX circuits. Number of different projects handled by Safe-PCB by the end of 2025: 1,545 RIGID-FLEX projects
RIGID-FLEX orders – consolidated data Safe Group 2019.. 2025, 2026 forecast
Hi Frequency Circuits (ceramic)
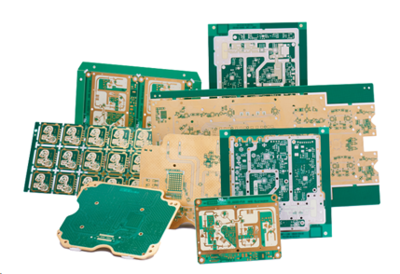
Used in telecom, 5G, IoT, RF and microwave applications, Hi frequency PCBs are also experiencing strong growth. Our stocks of ceramic resins from the 'Rogers' brand allow us to respond to client projects with great reactivity. Number of different projects handled by Safe-PCB by the end of 2025: 2,673 Hi Frequency projects
Hi frequency Ceramic PCB orders - consolidated data Safe Group 2015.. 2025, 2026 forecast
Deadline segmentation
Our partner Safe Company Ltd's production sites have always been organized in just-in-time flow. Objective: short deadlines to meet customer needs for prototypes. These charts reflect Safe-PCB's expertise in production lead times
Quality performance indicator No. 1
Non conformity ratioReworked orders
Relaunch of production order after non-conformity% of orders reworked after customer Non-Conformity Report
Quality performance indicator No. 2
Respect of deadlinesOn time
Products delivered before or at the due dateDelayed < 3 Days
Products delivered from 1 to 3 days after the due dateDelayed > 3 Days
Products delivered 4 days or more after the due date2015 .. 2025 - % of orders delivered before or at the due date
these figures include delays related to the carrier
2025 – Detail % of orders delivered before/after date confirmed
these figures include delays related to the carrier